Best AI for Charts and Graphs 2023
- Name
- Lynn Mikami
Published on
Data visualization is no longer a task reserved for data scientists or graphic designers. With the advent of Artificial Intelligence (AI), creating charts and graphs has become a breeze for anyone who needs to present data in an understandable and visually appealing manner. Whether you're a business analyst, a researcher, or just someone who loves to crunch numbers, AI is making it easier than ever to transform raw data into insightful visuals.
But what exactly is out there in terms of AI for charts and graphs? Is it reliable, and more importantly, is it free? This article aims to answer these questions and more, diving deep into the world of AI-generated charts and graphs. Buckle up as we explore the capabilities, technologies, and user experiences associated with these groundbreaking tools.
Great, thank you for providing the content. Let's integrate these products into the article, focusing on their unique features, pros, and cons.
What is AI for Charts and Graphs?
When we talk about AI for charts and graphs, we're referring to software tools that leverage machine learning algorithms to automate the process of data visualization. These tools can interpret complex data sets and generate charts or graphs that make the data easy to understand. They're particularly useful for people who need to visualize data but lack the technical skills to do so manually.
Is There an AI for Charts and Graphs for Free?
The question of whether there is an AI for charts and graphs that is free to use is a common one. The good news is that there are indeed options available that won't break the bank. For instance, Appy Pie's free AI graph maker offers basic functionalities for small-scale projects. This ai chart generator free of charge is perfect for those who are just getting started with data visualization and want to explore the capabilities of AI-generated charts without making a financial commitment.
- Pros: Free to use, easy to navigate, and ideal for simple projects.
- Cons: Limited features, may not handle complex data well.
Top 7 AI Tools for Charts and Graphs
ChartGPT: Quick and Efficient Data Visualization

ChartGPT (opens in a new tab) is an AI tool that automates the process of creating charts from text inputs. The software takes in a description of your data and creates visually appealing charts using React, Next.js, OpenAI, and Tailwind CSS.
- Pros: User-friendly interface, handles complex and unstructured data, visually appealing output.
- Cons: Some users have reported issues with API calls.
GraphMaker: Chat Your Way to Data Visualization

GraphMaker (opens in a new tab) is a chatbot-based graph maker that allows you to "talk" with your data. You can upload various file types, including Google Sheets, and the AI will process them for you. The chatbot interface makes it easy to ask for specific types of visualizations or data points.
- Pros: Supports Google Sheets, chatbot interface for efficient data extraction.
- Cons: The free version has limited graph generations and chatbot messages.
Chat2CSV: Transforming CSV Files Into Charts
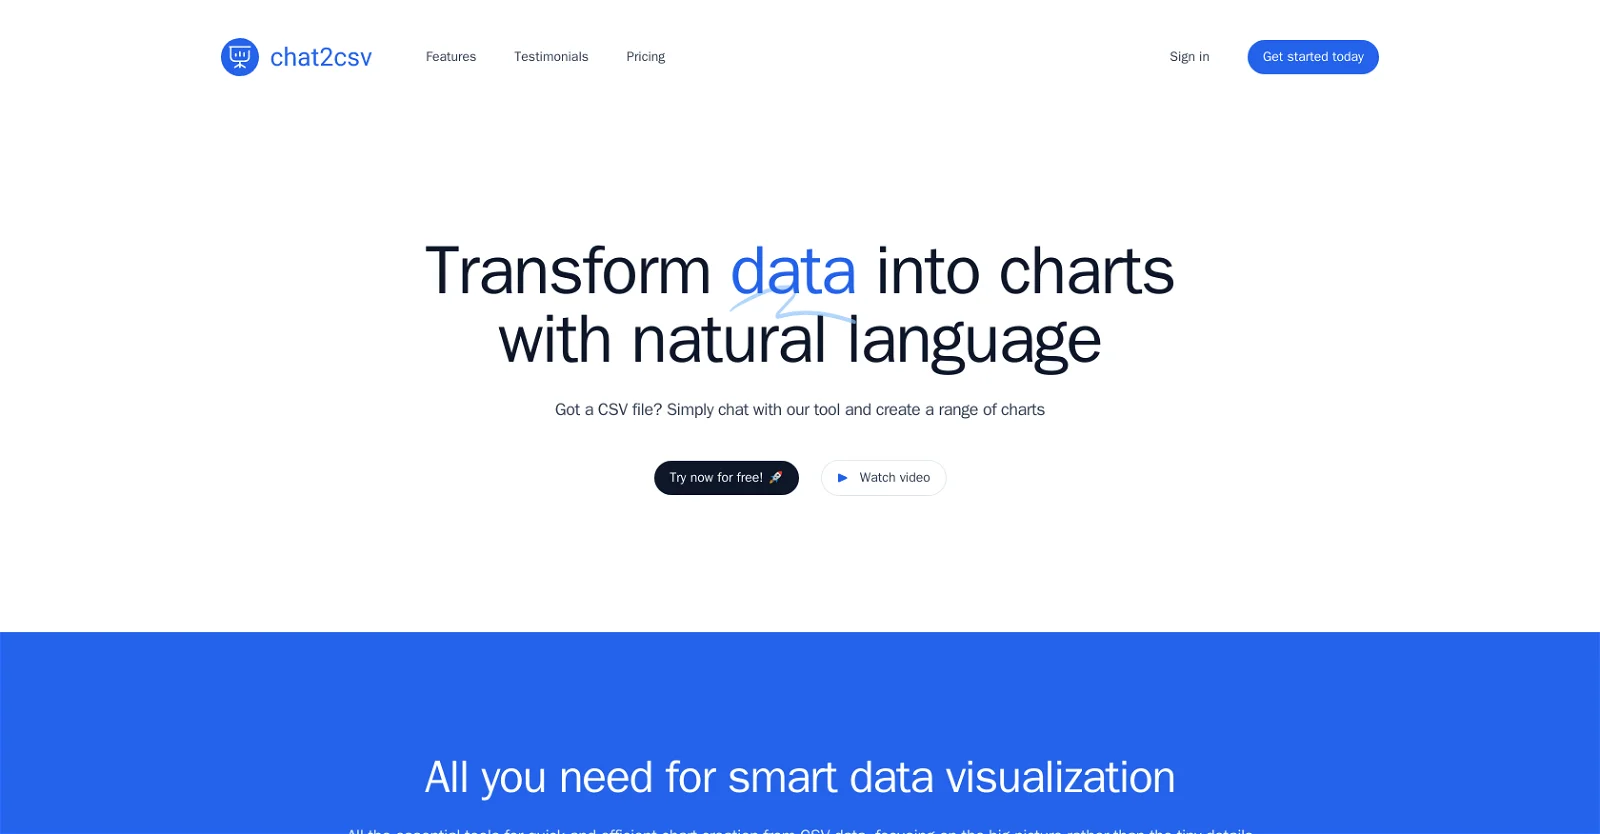
Chat2CSV (opens in a new tab) allows users to transform CSV files into various types of charts using natural language commands.
- Pros: Intuitive interface, AI assistant provides valuable suggestions, data security is a priority.
- Cons: Premium plan required for advanced features.
DataSquirrel: Automated Data Cleaning and Visualization
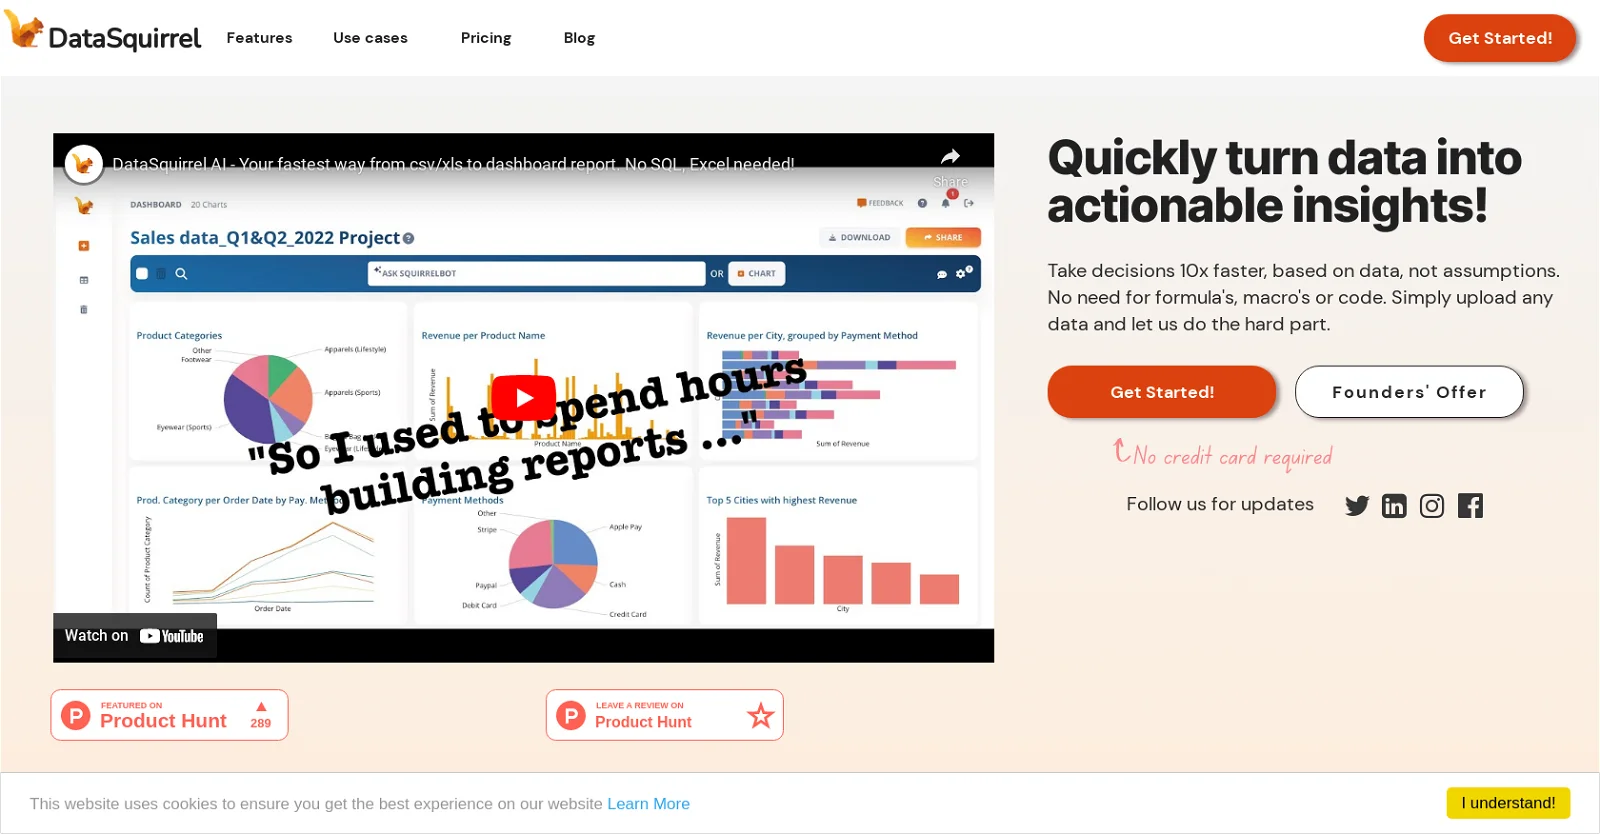
DataSquirrel (opens in a new tab) is an AI-powered tool that automates data cleaning and visualization processes.
- Pros: Eliminates manual data cleaning, customizable interactive dashboards, GDPR/PDPA-compliant.
- Cons: Premium plan required for advanced features.
ChartAI: Your Co-Pilot for Diagramming Tasks
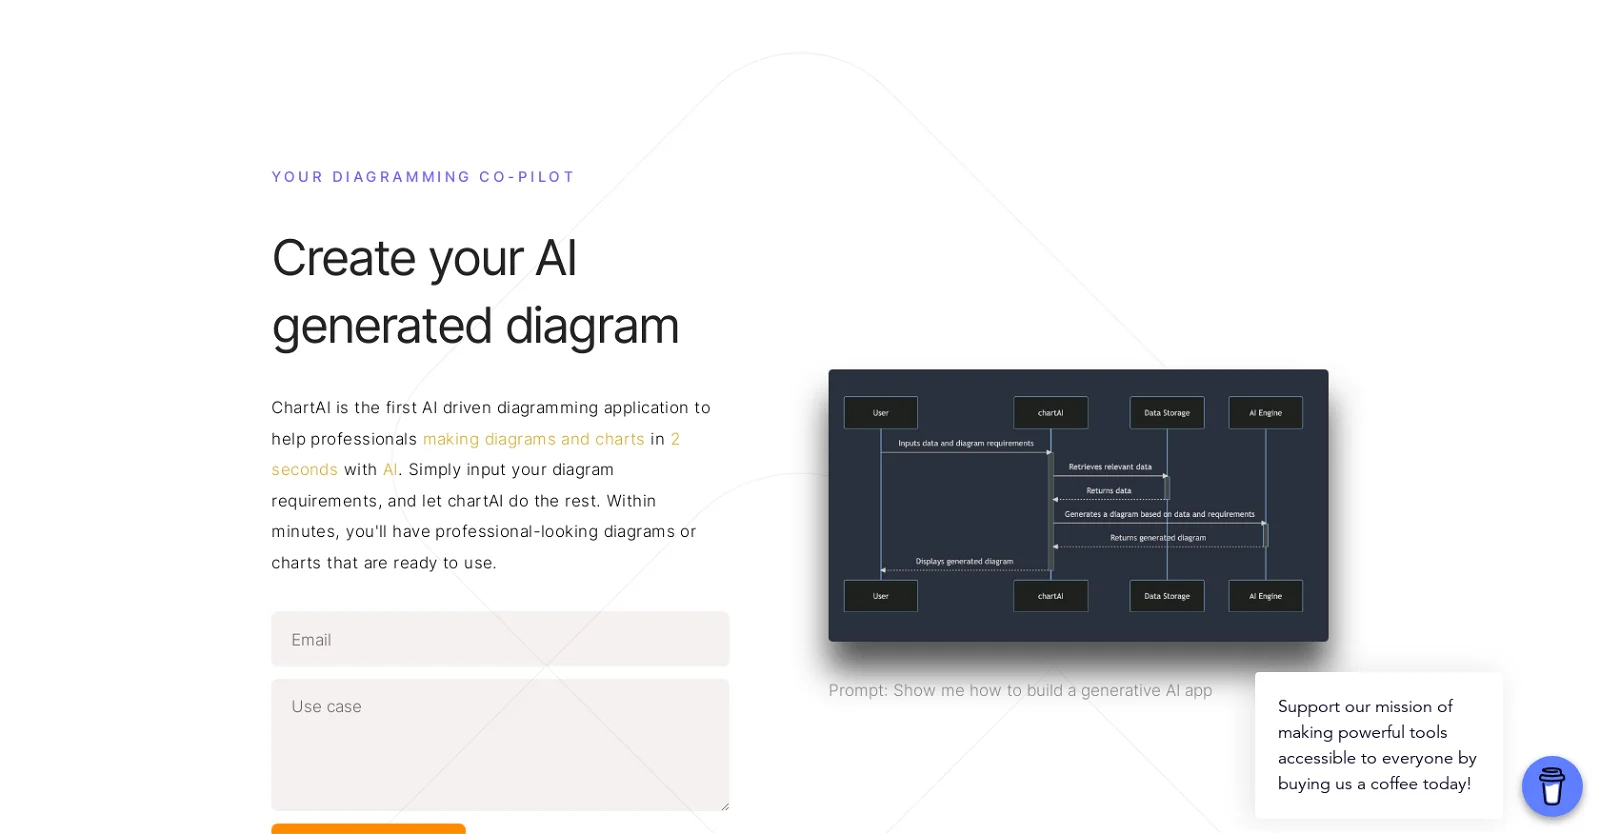
ChartAI (opens in a new tab) is an AI-based diagramming application designed to help professionals easily create high-quality diagrams and charts.
- Pros: Optimizes timelines, adjusts charts, identifies dependencies, free beta testing available.
- Cons: Pro plans coming in the future, may not be suitable for all types of data visualization.
Chart My Life: The AI-Powered Diary for Life Tracking
Chart My Life (opens in a new tab) serves as a flexible and customizable diary for tracking a wide range of habits and daily activities.
- Pros: Voice interface for easy tracking, provides real insights into habits and lifestyle, uses advanced voice recognition model.
- Cons: Currently invite-only, may not be suitable for those looking for precise data tracking.
Chartify: Hassle-Free Automatic Charting
Chartify (opens in a new tab) offers a new approach to data visualization. This automatic charting tool creates visually appealing charts from your data files. You can upload or connect your files from online drives, and Chartify will do the rest. It's a convenient ai graph maker that eliminates the need to manually input data.
- Pros: Direct integration with Google Account, automatic chart suggestions.
- Cons: Doesn't have a chatbot for refining data.
These products add another layer to the world of AI-generated charts and graphs, offering unique functionalities that cater to different user needs.
Comparing AI Graph Analysis and Text-Based Generators
When it comes to ai graph analysis, the capabilities of these tools extend beyond mere visualization. For example, DataSquirrel not only automates data cleaning but also offers auto-analysis features. This enables users to gain deeper insights into their data, identifying patterns and trends that may not be immediately obvious.
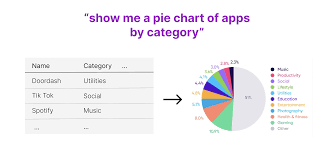
But what if you have data in text form? That's where ai graph generator from text comes into play. ChartGPT specializes in converting text inputs into visually appealing and accurate charts. This tool is a prime example of how far ai generated charts have come, offering a seamless experience for users who need quick visualizations of textual data.
- Pros: Handles text-based data, offers in-depth analysis, user-friendly.
- Cons: May require a basic understanding of data analysis concepts.
Conclusion
To sum up, the landscape of AI for charts and graphs is both diverse and promising. From free options like Appy Pie's graph maker to more specialized tools like ChartGPT and DataSquirrel, there's something for everyone. These tools are revolutionizing the way we approach data visualization, making it more accessible and insightful than ever before.
As for the future, the potential is immense. With advancements in machine learning and natural language processing, we can expect these tools to become even more sophisticated, offering a range of features that cater to various needs and complexities.
FAQs
What is the AI that converts data into charts?
ChartGPT and DataSquirrel are notable examples of AI that can convert data into charts.
Which software is best for graphs and charts?
The "best" software depends on your specific needs, but ChartGPT and DataSquirrel are highly versatile and offer a range of features.
Can ChatGPT create graphs?
No, ChatGPT specializes in natural language processing and does not have the capability to create graphs.
Does Adobe have a graph maker?
Adobe does offer data visualization features through its Adobe Illustrator software, but it is not specialized in graph making like the AI tools mentioned in this article.