Mitosheet: Excel for Python? Working with Spreadsheets in Your Jupyter Notebook

Data science is an ever-evolving field that demands versatile tools for data manipulation, analysis, and visualization. While Jupyter notebooks have been a go-to platform for many, there's always room for more specialized tools that can make life easier for data scientists. Enter Mitosheet, a game-changing tool that brings the power of spreadsheets into your JupyterLab and Streamlit environments. This article aims to be your comprehensive guide to understanding Mitosheet, its features, and how you can integrate it into your data science workflow.
This is gonna change Data Analytics forever!Introducing Mitosheets! 🚀Run spreadsheets inside your Jupyter Notebook & generate production-ready Python code for all the edits that you make!Check this out👇 pic.twitter.com/vD5wFgd8PC
— Akshay 🚀 (@akshay_pachaar) October 13, 2023
Whether you're a seasoned data scientist or a beginner looking to get your hands dirty with real-world data, Mitosheet offers a range of functionalities that can simplify your work. From installing the tool to diving into its advanced features, this guide covers it all. So, let's get started!
What is Mitosheet?
Mitosheet is a dynamic tool designed to work within JupyterLab and Streamlit apps. It allows you to manipulate Pandas dataframes in a spreadsheet-like interface, essentially bridging the gap between traditional spreadsheets and Python-based data analytics. But what sets Mitosheet apart is its ability to generate Python code corresponding to each edit you make in the spreadsheet. This means you're not just working in a silo; you're creating reusable code that can be integrated into larger Python projects.
Why Mitosheet is a Game-Changer
- Ease of Use: Mitosheet's intuitive interface makes it accessible even for those who are new to Python or data science.
- Code Generation: Every action you perform in the Mitosheet generates Python code, usually utilizing the Pandas library. This code is production-ready and can be used in other parts of your project.
- Compatibility: Mitosheet is highly compatible with Python, making it a seamless addition to your existing Jupyter notebooks or Streamlit apps.
How Does Mitosheet Work?
When you perform an action in Mitosheet—be it data import, manipulation, or visualization—the tool automatically generates the equivalent Python code. For instance, if you filter a column to show only specific values, Mitosheet will produce a Pandas code snippet that performs the same action. This code appears in a Jupyter cell directly below the Mitosheet, ready to be executed or integrated into your project.
Here's a simple example. Let's say you have a dataframe named df and you want to filter out rows where the column 'Age' is less than 25. In Mitosheet, you'd simply apply the filter using the interface. The corresponding Python code generated would be:
df_filtered = df[df['Age'] >= 25]This feature is particularly useful for those who may be proficient in data analysis but not as comfortable with coding. It provides a learning curve, helping users understand how their actions translate into Python code.
By offering a blend of spreadsheet simplicity and Pythonic power, Mitosheet is carving a niche for itself in the data science toolkit. Whether you're conducting exploratory data analysis, cleaning data, or creating visualizations, Mitosheet offers a streamlined, efficient way to get the job done.
How to Install Mitosheet
Installing Mitosheet is a straightforward process that can be done in multiple ways, depending on your preferred environment. The most common method is using Python's package manager, pip. However, Mitosheet also offers flexibility by allowing installations in Docker containers and directly into Streamlit apps.
Installing Mitosheet with pip
The simplest way to get Mitosheet up and running is by using pip, Python's package manager. Open your terminal and run the following command:
pip install mitoinstallerAfter the installation is complete, you'll need to run the installer:
python -m mitoinstaller installThis command installs Mitosheet for both classic Jupyter Notebooks and JupyterLab 3.0. The process is usually quick, but the time can vary depending on your system.
Installing Mitosheet in Docker Containers
Docker offers a way to package all of your application's dependencies in a container, making it easy to distribute and run. Installing Mitosheet in a Docker container ensures that all dependencies are neatly encapsulated, providing a consistent environment. Here's how to do it:
-
Create a Dockerfile: Start by creating a Dockerfile in your project directory.
-
Specify the Base Image: Use a Python image as your base image. Add the following line to your Dockerfile:
FROM python:3.8 -
Install Jupyter Notebook: Mitosheet is an extension for Jupyter, so you'll need to install Jupyter Notebook or JupyterLab. Add these lines to your Dockerfile:
RUN pip install notebook -
Install Mitosheet: Now, install Mitosheet by adding the following command:
RUN pip install mitosheet -
Enable Mitosheet Extension: Finally, enable the Mitosheet extension for Jupyter Notebook.
RUN jupyter nbextension enable mitosheet --py --sys-prefix -
Build the Docker Image: Save your Dockerfile and build the image using the following command:
docker build -t my-mitosheet-container . -
Run the Container: Once the image is built, run it using:
docker run -p 8888:8888 my-mitosheet-container
Installing Mitosheet in Streamlit Apps
Streamlit is a popular framework for creating web apps with Python. You can directly integrate Mitosheet into your Streamlit apps to leverage its data manipulation capabilities. Here's how:
-
Install Streamlit: If you haven't already, install Streamlit using pip:
pip install streamlit -
Install Mitosheet: Install Mitosheet with the following command:
pip install mitosheet -
Import in Your App: In your Streamlit app, import Mitosheet as follows:
import mitosheet -
Initialize Mitosheet: To initialize Mitosheet within your Streamlit app, use the following code:
mitosheet.sheet()
Installing Mitosheet Extension for Jupyter Notebook
If you're a data scientist or researcher who primarily works in Jupyter notebooks, installing the Mitosheet extension is straightforward.
-
Install Mitosheet: Open your terminal and run the following command to install Mitosheet:
pip install mitosheet -
Enable Extension: Enable the Mitosheet extension for Jupyter Notebook with this command:
jupyter nbextension enable mitosheet --py --sys-prefix -
Verify Installation: Open a new Jupyter notebook and run the following Python code to initialize Mitosheet:
import mitosheet
mitosheet.sheet()
Creating Your First Mitosheet
After successfully installing Mitosheet, the next step is to create your first Mitosheet and get a feel for its features. Creating a new Mitosheet is as simple as clicking a button in your JupyterLab or Streamlit interface.
Importing Data into Mitosheet
Mitosheet supports point-and-click CSV and XLSX imports, making it incredibly easy to get your data into the tool. Here's how you can do it:
- Open a new Mitosheet by clicking on the Mitosheet icon.
- Navigate to the 'Import' tab.
- Choose the file you wish to import and click 'Open'.
Your data will now be displayed in a spreadsheet-like interface, ready for manipulation.
Basic Operations in Mitosheet
Once your data is imported, you can perform a variety of operations:
- Filtering and Sorting: Easily filter and sort columns using the toolbar at the top of each column.
- Pivot Tables: Create Excel-style pivot tables to summarize your data.
- Column Operations: Perform basic calculations and transformations on columns.
For example, if you want to calculate the average age in a column named 'Age', you would simply select the column, navigate to the 'Operations' tab, and choose 'Average'. Mitosheet will not only perform the calculation but also generate the corresponding Python code:
average_age = df['Age'].mean()Creating your first Mitosheet is a breeze, and its intuitive interface ensures that you can hit the ground running, regardless of your expertise level. With features like point-and-click data import and a host of data manipulation options, Mitosheet is designed to make your data analysis workflow as smooth as possible.
To open your existing Mitosheet virtual env, follow these steps:
# Activate your env
conda activate mitoenv

# Launch Jupyter Lab
jupyter lab
How to Use Functions in Mitosheet
Mitosheet is not just another spreadsheet tool; it's a comprehensive platform that offers a wide array of functions specifically designed for data analysis and manipulation. From basic operations like filtering and sorting to more advanced features like data visualization, Mitosheet has it all.
Data Manipulation Functions
Mitosheet excels in offering a variety of data manipulation functions. Here are some of the key features:
- Column Transformations: Easily apply transformations like log, square root, and trigonometric functions to entire columns.
- Text Operations: Perform text manipulations like substring extraction, case conversion, and pattern matching directly within Mitosheet.
- Date and Time Functions: Handle date and time data with ease, thanks to Mitosheet's built-in functions for date parsing, formatting, and arithmetic.
For instance, if you want to extract the year from a date column named 'Purchase_Date', Mitosheet will generate Python code like this:
df['Year'] = df['Purchase_Date'].dt.yearData Visualization in Mitosheet
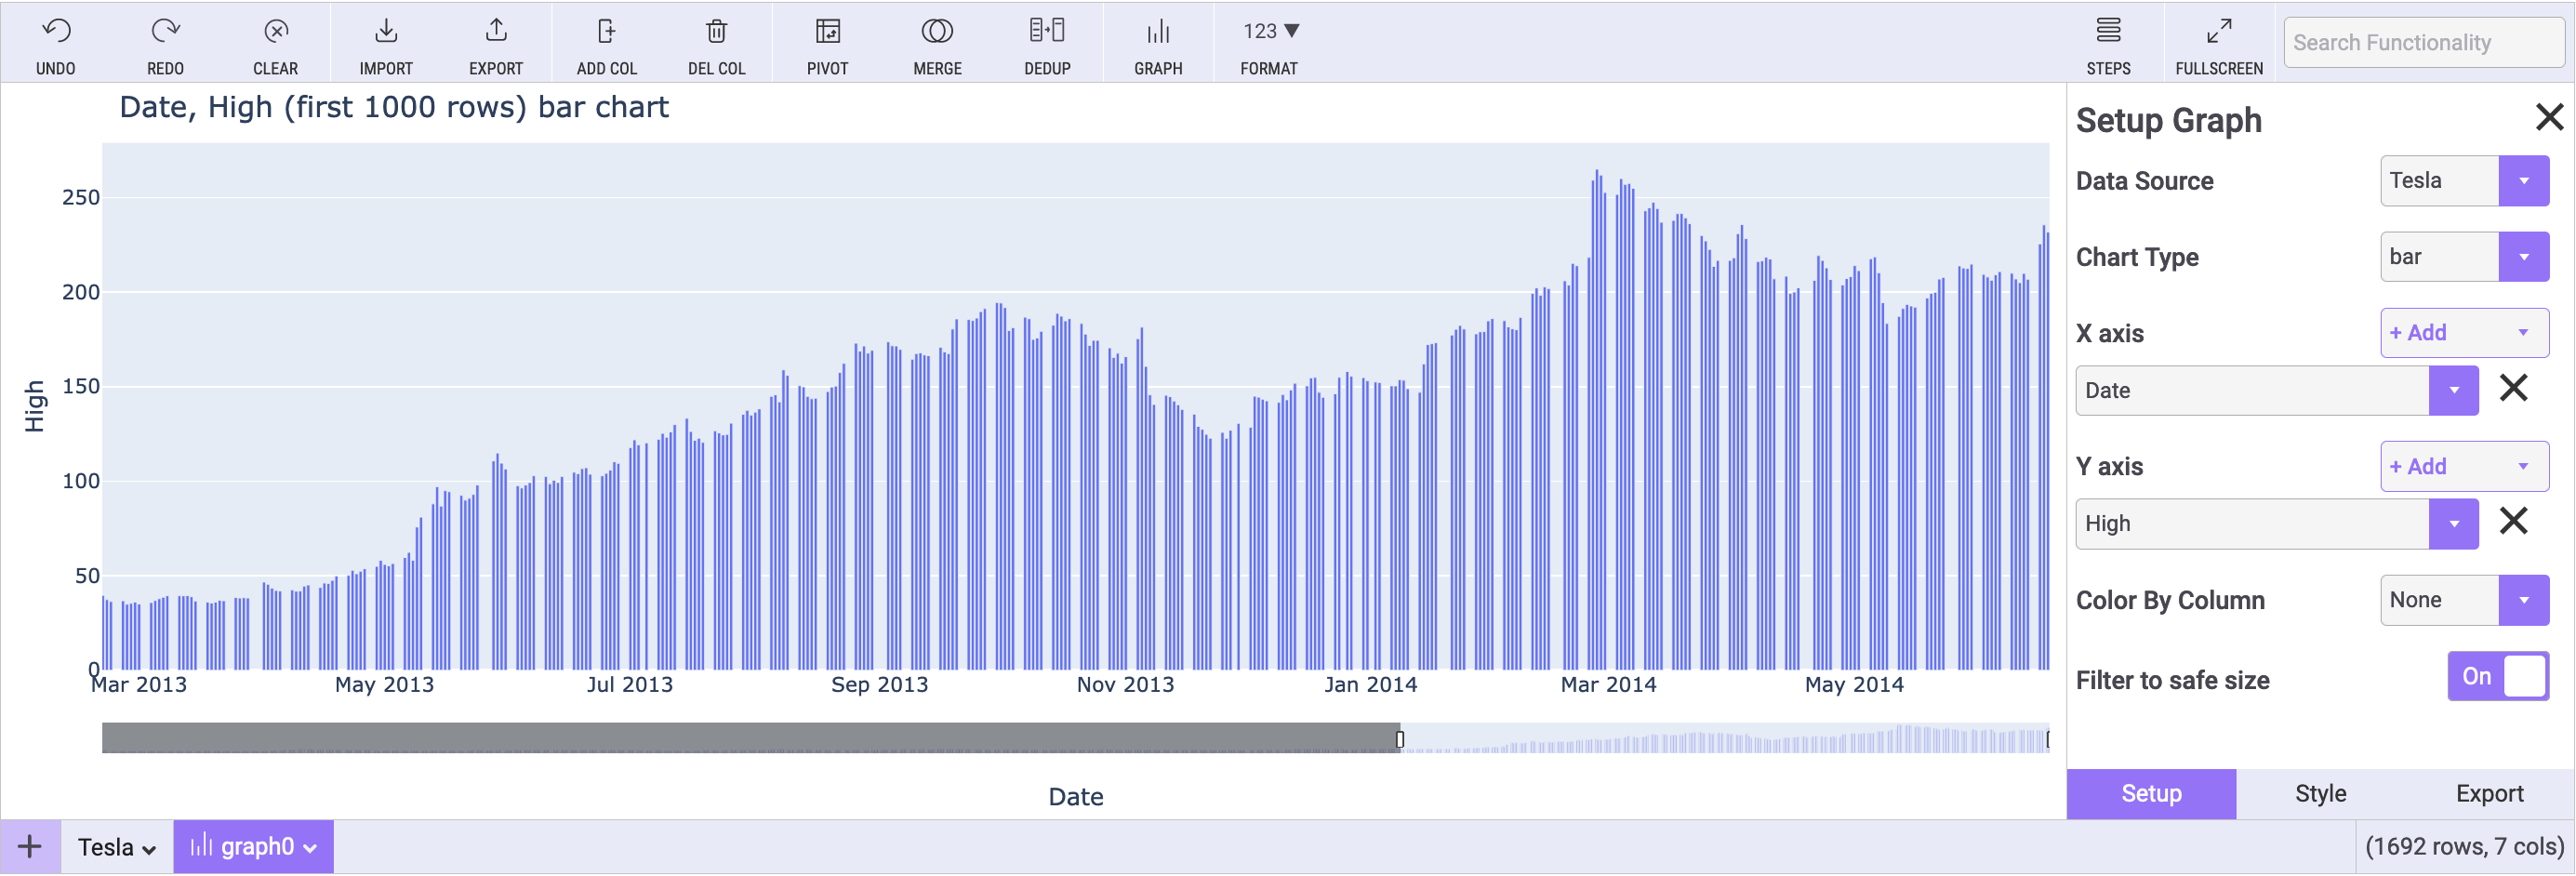
One of the standout features of Mitosheet is its data visualization capabilities. You can create a variety of charts and graphs directly within the tool, including:
- Bar Charts
- Line Graphs
- Pie Charts
- Scatter Plots
Creating a chart is as simple as selecting the data and choosing the chart type. Mitosheet takes care of the rest, even generating Python code using libraries like Matplotlib or Seaborn.
Advanced Features
Mitosheet also offers some advanced features that can be incredibly useful for more complex data analysis tasks:
- Join Operations: Perform SQL-like joins between different dataframes.
- Grouping and Aggregation: Use the 'Group By' feature to aggregate data based on specific columns.
For example, if you want to find the total sales for each product category, you'd perform a 'Group By' operation on the 'Category' column and then sum the 'Sales' column. The Python code generated would look something like this:
df_grouped = df.groupby('Category')['Sales'].sum().reset_index()By providing a wide range of functions that cater to both basic and advanced data manipulation needs, Mitosheet stands as a versatile tool in the data science toolkit. Its ability to generate Python code for each operation not only makes it easier to integrate your work into larger projects but also serves as a learning tool for understanding how these operations are performed programmatically.
Auto Generate Python Code for Spreadsheets with Mitosheet AI
Mitosheet is not just a static tool for data manipulation; it also incorporates AI functionalities that can significantly speed up your data analysis process. These AI features are designed to automate repetitive tasks, making your workflow more efficient.
Every edit you make to the @tryMito spreadsheet automatically generates Python code.Take automation into your own hands using the tools you already know.Check this out👇https://t.co/hvrhzKUHzx (opens in a new tab) pic.twitter.com/xc6GCb7aC7
— Akshay 🚀 (@akshay_pachaar) October 13, 2023
Auto-Suggestions and Predictive Analysis
One of the most exciting AI features in Mitosheet is its ability to offer auto-suggestions based on your data. For example, if you're working with a dataset that includes various metrics like sales, revenue, and customer ratings, Mitosheet can automatically suggest relevant visualizations or statistical tests that could be useful for your analysis.
Anomaly Detection
Another powerful AI feature is anomaly detection. If your dataset contains outliers or anomalies, Mitosheet can automatically flag these for you. This is particularly useful in scenarios like fraud detection or quality control, where identifying anomalies quickly is crucial.
Data Cleaning Automation
Data cleaning is often the most time-consuming part of any data analysis process. Mitosheet's AI capabilities can automate many aspects of data cleaning. From handling missing values to correcting data types, Mitosheet can take care of it all, saving you valuable time.
For instance, if you have a column with missing values, Mitosheet can automatically fill these in based on the mean, median, or mode of the column. The generated Python code might look like this:
df['Column_Name'].fillna(df['Column_Name'].mean(), inplace=True)By integrating AI into its core functionalities, Mitosheet goes beyond being a mere spreadsheet tool. It becomes a smart assistant that can guide you through your data analysis journey, making recommendations and automating tasks along the way.
How to Use Generated Code in Mitosheet
One of the most compelling features of Mitosheet is its ability to generate Python code for every action you take within the tool. This code is not just a byproduct; it's a valuable asset that can be used in various ways.
Integrating Code into Jupyter Notebooks
Every operation you perform in Mitosheet is automatically translated into Python code that appears in a Jupyter cell below the Mitosheet. This code can be executed directly within the notebook, allowing you to see the results immediately.
Reusability and Collaboration
The generated code is also highly reusable. You can easily copy it into other Python scripts or Jupyter notebooks. This is particularly useful for collaborative projects where you might need to share your data manipulation steps with team members.
For example, if you've filtered and sorted a dataframe in Mitosheet, the generated code can be shared with a colleague who can then apply the same transformations to a similar dataset. The code might look something like this:
df_filtered_sorted = df[df['Age'] > 25].sort_values(by='Salary', ascending=False)Mitosheet Alternatives
While Mito offers a unique blend of spreadsheet-like interface and Python code generation for data analysis, there are other tools and libraries you might consider:
-
PandasGUI: This is a Python library that provides a GUI for Pandas DataFrames. It allows for easy data manipulation but doesn't generate Python code based on your activities.
-
DataPrep: This Python library aims to simplify the data preparation process, offering various functionalities to clean, visualize, and understand data.
-
Jupyter Widgets: These are interactive widgets for Jupyter notebooks. While not a direct alternative, they can be used to create interactive dashboards for data analysis in a Jupyter Notebook.
-
Tableau: A well-known data visualization tool that also allows for some level of data manipulation. It's not Python-based but offers robust features.
-
Excel Power Query: For those who are more comfortable with Excel, Power Query offers a range of data manipulation capabilities, including a GUI for data transformation.